Minimal Space. Maximum Impact! Designed for when every millimeter matters> the new IRONLESS UNANO SERIES
Semiconductors
Increase throughput and precision of your system
Display
Enhance accuracy and precision with linear motors
Science and aerospace
Improve motion quality for a variety of applications
Machine tooling
Robust solutions for increased speed and precision
Digital cutting
Create modular and high throughput applications
Printing
Increase printing speed and quality using linear motors
Robotics
Integrate compact solutions for guaranteed uptime and high dynamics
Life science
Establish precise and clean integrated solutions
Woodworking
Maximize performance and accuracy for high throughput
Stages and system solutions
Compact integration and high performance for your axis
Vacuum applications
Best performance for clean and vacuum applications
Characteristics
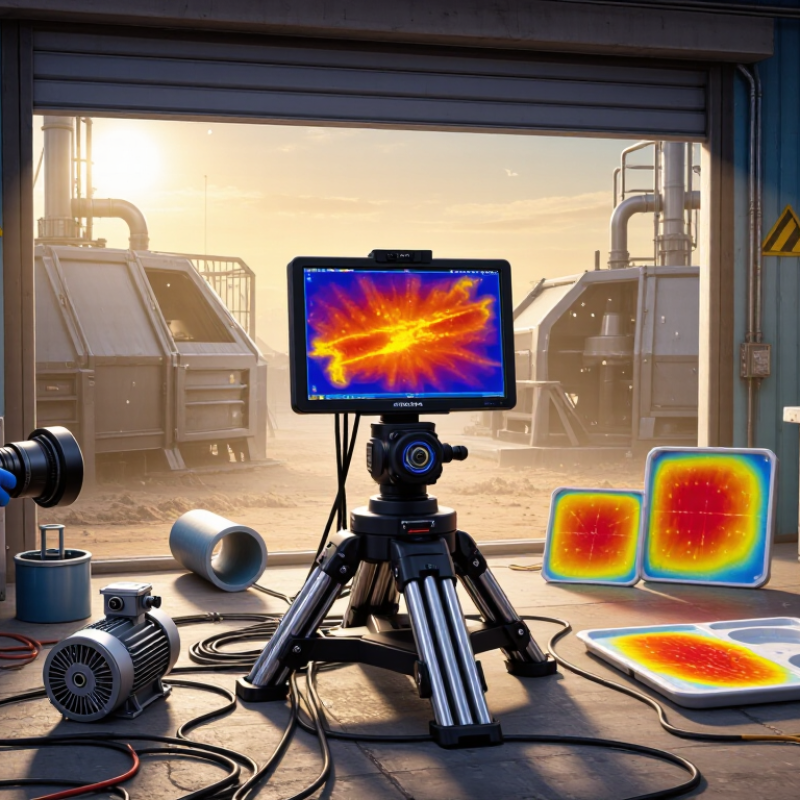
Choosing the right Ir Imaging Sensor is rarely a matter of selecting the highest resolution. Real performance depends on wavelength, thermal sensitivity, optics, and operating conditions.
In practical evaluations, a sensor that performs well in a laboratory may struggle outdoors. Bright sunlight, reflective metal, dust, vibration, and changing temperatures can alter results. Start with the scene, not the product brochure. Define the target temperature range, detection distance, field of view, and required frame rate. A 640 × 512 sensor may reveal valuable detail, but a smaller sensor could fit a compact, lower-cost system more effectively. Every specification has a trade-off.
Look closely at NETD, spectral response, calibration stability, pixel pitch, and lens compatibility. These details influence whether the image remains useful after installation. For industrial monitoring, long-term reliability and simple maintenance may matter more than peak image quality. For research, measurement accuracy and repeatable data deserve greater weight. Confirm testing methods with the manufacturer, because performance figures are not always directly comparable. That part is often overlooked.
A sensible evaluation includes hands-on testing. Place the sensor near its intended environment, capture images at different temperatures, and inspect weak contrast targets. Check startup time, software support, power consumption, and data interfaces. Ask for test reports, warranty terms, and documented environmental ratings. No selection guide removes every uncertainty. Even experienced teams can choose poorly when they ignore integration details. The best Ir Imaging Sensor is the one that delivers dependable information for your specific application, not merely impressive numbers on a specification sheet.
How to Choose the Best IR Imaging Sensor?
Choosing an IR imaging sensor starts with its operating principle. Thermal detectors, such as microbolometers, measure temperature-driven changes in resistance. They usually work without cooling and suit building inspections, industrial maintenance, and night observation. Photon detectors respond directly to incoming infrared photons. They offer faster response and greater sensitivity, but often need cooling and more careful integration. That difference affects size, power use, cost, and maintenance.
The wavelength band matters just as much. Near-infrared sensors can capture reflected light, while mid-wave and long-wave sensors detect different thermal signatures. A warm pipe may appear clearly in a long-wave image, yet humidity or smoke can reduce contrast. Check the sensor’s noise-equivalent temperature difference, resolution, frame rate, and spectral response. A detailed image is not automatically a reliable measurement. Lens material and field of view also shape the result.
Real testing should happen in the intended environment. Compare images beside a calibrated reference source, not only in a showroom. Examine focus at the closest working distance, because distant clarity can hide poor edge performance. Enclosures need protection from dust, moisture, vibration, and temperature changes. I once overvalued pixel count and underestimated calibration drift. That was a useful mistake. Stable readings, suitable optics, and consistent thermal calibration often matter more than impressive specifications.
| Sensor Type | Typical Spectral Range | Operating Principle | Cooling Requirement | Main Advantages | Main Limitations | Common Applications | Best Selection Scenario |
|---|---|---|---|---|---|---|---|
| Uncooled Microbolometer | Long-wave infrared (LWIR), typically 8–14 µm | Incoming infrared radiation changes the temperature and electrical resistance of a suspended absorber element. The resistance change is converted into an image. | No active cooling required | Compact, low power consumption, low maintenance, generally lower system cost, and suitable for portable equipment. | Usually lower sensitivity and slower response than cooled photon detectors; performance can be affected by ambient temperature changes. | Building inspection, predictive maintenance, security, firefighting, process monitoring, and automotive night vision. | Choose this type when low size, weight, power, and cost are more important than maximum sensitivity or ultra-fast imaging. |
| Cooled MWIR Photon Detector | Mid-wave infrared (MWIR), typically 3–5 µm | Photons generate charge carriers in a semiconductor material. The resulting electrical signal is read out to form an image. | Active cooling is normally required to reduce dark current and detector noise. | High sensitivity, fast response, strong performance for hot-object detection, and good imaging through some atmospheric conditions. | Higher power consumption, larger size, greater cost, mechanical complexity, and possible cooler vibration or service requirements. | High-speed thermal analysis, scientific imaging, gas plume detection, aerospace observation, and long-range surveillance. | Choose this type when high detectivity, fast frame rates, or accurate measurement of relatively hot targets is essential. |
| Cooled LWIR Photon Detector | Long-wave infrared (LWIR), commonly 8–12 µm or 8–14 µm | Infrared photons produce charge carriers in a narrow-bandgap semiconductor. Cooling suppresses thermally generated carriers and improves signal quality. | Active cooling is normally required. | Very high sensitivity, excellent low-temperature imaging, and strong performance when small temperature differences must be resolved. | Complex cooling system, higher operating cost, longer startup time, and increased system size and weight. | Specialized thermography, astronomy, research instrumentation, industrial inspection, and low-temperature target observation. | Choose this type for demanding measurements where maximum temperature sensitivity is more important than portability. |
| SWIR InGaAs Sensor | Short-wave infrared (SWIR), typically about 0.9–1.7 µm | Near-infrared photons create electron–hole pairs in an indium gallium arsenide semiconductor, producing a measurable electrical signal. | Usually uncooled; cooling may be used for lower noise or specialized scientific systems. | Captures reflected and transmitted information, can image through certain materials, and provides useful spectral contrast beyond visible light. | Does not primarily measure heat emission; performance depends on illumination or reflected radiation, and detector cost can be relatively high. | Semiconductor inspection, sorting, moisture analysis, laser-beam profiling, low-light imaging, and machine vision. | Choose this type when material identification, reflected-light imaging, or imaging through selected plastics and coatings is required. |
| Thermopile Array | Broad infrared response; commonly optimized around 8–14 µm | Absorbed radiation creates a temperature difference across thermocouples, generating a voltage through the Seebeck effect. | No active cooling required | Low power consumption, simple construction, good long-term stability, and suitability for basic temperature mapping. | Typically lower spatial resolution, slower response, and lower sensitivity than many microbolometer or photon-detector arrays. | Presence detection, occupancy sensing, simple thermal monitoring, and low-cost temperature measurement. | Choose this type for simple, low-power thermal detection where fine image detail is not a primary requirement. |
| Pyroelectric Sensor Array | Broad infrared response, often covering parts of the 3–14 µm region | Changes in absorbed radiation alter the polarization of a pyroelectric material and produce a transient electrical signal. | No active cooling required | Low standby power, simple electronics, and effective detection of moving or modulated infrared sources. | Not well suited to measuring static scenes without modulation; generally lower image quality and slower or less continuous response. | Motion detection, flame monitoring, occupancy sensing, and specialized infrared spectroscopy. | Choose this type when event detection or motion sensing is more important than continuous high-resolution thermal imaging. |

How to Choose the Best IR Imaging Sensor?
Defining the Required Wavelength Range and Spectral Response
Start with the target’s thermal behavior, not the camera’s advertised resolution. Short-wave infrared, typically 0.9–1.7 μm, responds strongly to reflected light and can reveal moisture, plastics, and material differences. Mid-wave infrared, around 3–5 μm, suits high-temperature inspection and gas visualization. Long-wave infrared, usually 8–14 μm, captures heat from people, machinery, and buildings.
The atmosphere matters too. The World Meteorological Organization’s 2023 observing-system guidance identifies atmospheric transmission as a key factor in remote sensing accuracy. Dust, humidity, and smoke can weaken selected wavelengths. A sensor may perform well in a laboratory, then lose contrast across a humid factory floor. That gap is easy to underestimate.
Read the complete spectral response curve, not only its peak wavelength. The EMVA 1288 Release 4.0 framework emphasizes measurable parameters such as responsivity, noise, signal-to-noise ratio, and detectivity. These values show whether the sensor can distinguish a small temperature difference from background noise. For example, a narrow response may improve selectivity, while a broader response can collect more energy. Neither option is automatically better. I have seen specifications hide this trade-off.
Check the detector material, filter design, lens transmission, and calibration temperature together. A response curve that ends at 14 μm may still deliver weak sensitivity near that boundary. Test the sensor with the actual surface, distance, and atmosphere. That practical step often changes the original selection.
Defining the required wavelength range and spectral response is the first step in sensor selection. The chart shows typical nominal spectral coverage for commonly used detector material families. Select a detector whose response spans the target emission, reflection, or transmission band of the application.
Typical ranges shown: silicon approximately 0.4–1.1 µm, indium gallium arsenide approximately 0.9–1.7 µm, extended indium gallium arsenide approximately 1.0–2.6 µm, indium antimonide approximately 1–5.5 µm, and mercury cadmium telluride approximately 2–14 µm. Actual spectral response depends on composition, cutoff design, temperature, optics, filters, and operating conditions.
Choosing an IR imaging sensor starts with the scene, not the catalog. Resolution shows small targets, but it cannot fix poor thermal contrast. A 640×512 sensor can reveal finer details than a 320×256 unit, yet lens selection and distance still dominate results. Sensitivity is often stated as NETD. Values below 40 mK are commonly preferred for detecting small temperature changes, especially on pipes, circuit boards, and moving machinery. The 2024 MarketsandMarkets Thermal Imaging Market report projects growth from about $4.1 billion to $6.7 billion by 2029. That expansion reflects wider industrial monitoring, not automatic image quality.
Thermal performance deserves closer attention. Check the operating range, frame stability, calibration interval, and response under humidity or vibration. ASTM E1933-14 stresses controlled measurement practice, including emissivity and reflected temperature. IEC 80601-2-59:2019 also highlights accuracy and uniformity for screening systems. In field inspections, I have seen a high-resolution image lose useful detail because the sensor saturated near a hot motor. I still get this wrong sometimes. A perfect specification can mislead.
Tips: Match pixel size to working distance. Compare NETD at the same temperature range. Test a blackened reference surface before deployment. Record ambient temperature, emissivity, and lens condition. If the target barely fills a few pixels, higher resolution may help more than lower NETD. But this tradeoff needs testing on the actual site.
Choosing an IR imaging sensor starts with the scene, not the specification sheet. The 8–14 μm atmospheric window often suits long-wave thermal imaging, as described by NOAA’s infrared remote-sensing guidance. However, humidity, dust, rain, and reflective surfaces can weaken measurements. IEC 60529 ingress ratings help assess enclosure protection, but an IP rating does not guarantee stable thermal accuracy. Test the sensor near the real mounting location.
Integration is equally important. Check optical format, pixel pitch, field of view, frame rate, power demand, and interface latency. A sensor may deliver excellent laboratory images yet fail beside a vibrating motor or a hot exhaust pipe. ISO 18434-1 recommends considering measurement conditions when using thermography for machinery monitoring. The 2024 MarketsandMarkets report projects continued growth in the thermal imaging market, but market growth does not remove application risks. I have seen teams choose higher resolution when better calibration would matter more.
Tips: Record target distance, surface emissivity, ambient temperature, and viewing angle. Test through the intended window or protective cover. Verify whether the housing, cable, processor, and software use the same communication standard. Leave thermal headroom in the power design. Small oversights become expensive redesigns. Also question the data: a polished image can still be physically misleading. Recheck performance after condensation, vibration, and temperature cycling. Calibration drift deserves attention, even when early field images appear consistent.
Choosing an infrared imaging sensor requires more than comparing quoted prices. The lowest-cost unit may need extra calibration, shielding, or replacement labor. In practical evaluations, I compare total ownership costs over five years. Record power use, software fees, calibration intervals, and installation time. Small details matter.
A sensor near a furnace may need thermal protection and stable cooling. Outdoor equipment faces condensation, vibration, dust, and sudden temperature changes. Request documented test methods and operating limits. Evidence aligned with recognized environmental standards is more useful than broad marketing claims. Do not accept vague promises. Inspect sample images from real operating conditions, not only laboratory scenes.
Higher resolution is not always better if it increases data storage and processing demands. I have occasionally overvalued image detail while overlooking integration costs. That mistake is easy to repeat. Choose a communication interface that future controllers can support. Confirm whether software updates remain available and backward compatible. Keep spare units only when downtime would seriously affect operations. For a small monitoring system, moderate resolution and dependable calibration may be the wiser investment. For research, changing targets may justify more flexible hardware.
The best choice is the sensor that remains useful after the first installation.